
Backtests: How to Turn a Trading Idea into a Reliable System
In algorithmic trading, there is a fine line between systematic money management and playing roulette. That line is backtesting.
Many beginners launch bots relying on intuition or settings copy-pasted from signal chats. The result is predictable: the market phase shifts, and the deposit vanishes. This article is your guide to verifying hypotheses on the Veles Finance platform.
We will break down how our simulation engine works, why pessimism is better than optimism, and how to save your money by running your strategy through historical crises.
Why Look into the Past?
The market remembers everything. Fear, greed, crowd panic—emotions are cyclical. Charts change, but human psychology remains the same. A backtest reconstructs your algorithm’s behavior in the past to estimate its chances in the future.
Important: A backtest does not predict the future. It does a different, more critical job: it filters out strategies that are definitely broken. For example, situations where you used too much leverage and got liquidated within a month.
If a strategy doesn’t make money on historical data (where every move is recorded), it has zero chance in live trading. Tests turn your guesses into statistics. Instead of “I feel like it’s going up,” you operate with facts: “Over a one-year period, this model was profitable 70% of the time.”
Professional workflow with Veles follows this algorithm:
- Hypothesis. You spot a pattern. Example: “If RSI drops below 30 on the 15-minute timeframe, a bounce usually occurs.”
- Configuration. Translate the idea into Veles bot language: set filters, order grids, and indents.
- Calibration. Run the settings on a specific historical period (e.g., Autumn 2023). Tweak the parameters.
- Battle Test. Take the exact same settings and run a test on a different period (e.g., Winter 2024). If the results degrade sharply, you have simply fitted the solution to the answer (overfitting). The strategy is not viable.
- Forward Test. Launch on a real account with minimal volume. This reveals nuances the simulator cannot see: real liquidity in the present moment.
By going from hypothesis to forward testing, you eliminate randomness. Now, let’s look at why the accuracy of this analysis depends directly on the engine’s algorithms.
The Veles Engine: Event-Driven Simulation
Many profit calculators lie because they use primitive logic: “if the price touched the level, assume the order is filled.”
Veles in 2026 works differently. We use Event-Driven Simulation technology.
Why is this critical? Unlike simple testers that look only at candle close prices, our engine reproduces the flow of trading inside every minute. We check not just the fact that the price touched a level, but the presence of liquidity in the order book.
Imagine a 1-hour candle. In simple testers, if the price touched both your Take Profit and Stop Loss within that hour, the system often counts it as a profit. But in reality, the price could have dived down, stopped you out, and only then surged up.
Our engine sees this sequence of events tick-by-tick. If the Stop Loss was triggered at the 15th minute of the hour, we record a loss. No illusions.
Pessimistic Scenario and Spreads
The most useful feature for stress-testing a strategy is the real execution simulation mode. In the interface, this accompanies the “Pessimistic scenario” checkbox.
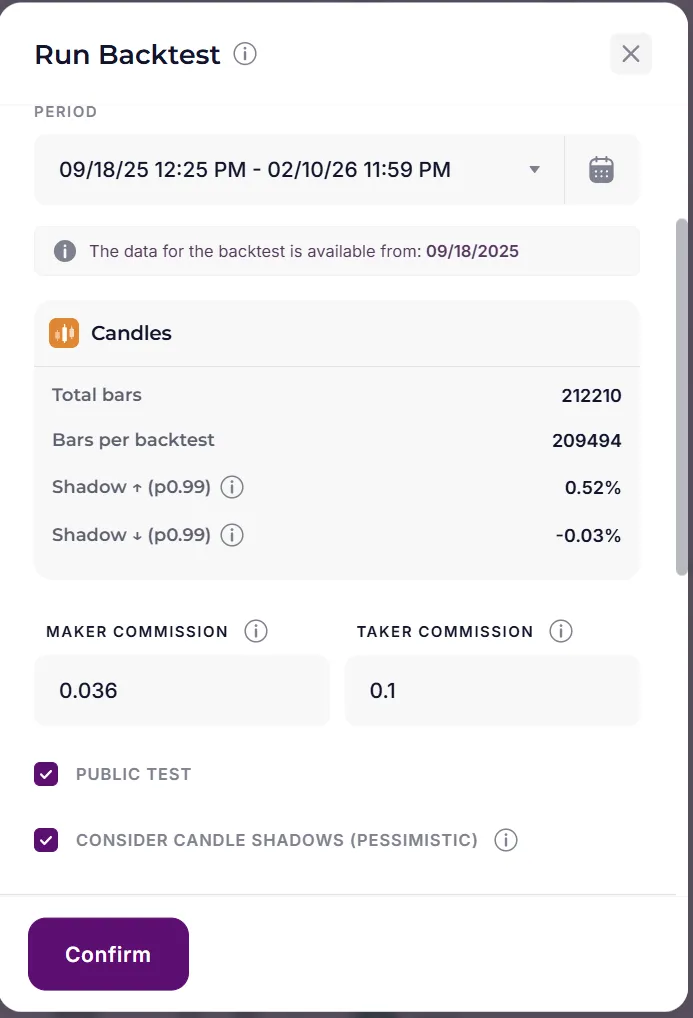
In real life, you rarely buy an asset at the perfect price. There is spread, network latency, and slippage. The system automatically worsens entry and exit prices, modeling the real queue in the exchange order book.
- Optimistic Scenario: Price touched the level — you instantly exited with a profit.
- Realistic Veles Approach: We account for the spread. If a candle wick only slightly touched your order, the trade might not execute because, in reality, there wouldn’t be enough liquidity for you.
If a strategy survives this mode, it is ready for the real battle for liquidity, not just paper profits.
Crash Tests: Surviving Market Catastrophes
Your bot must go through hell. Run it on historical periods when panic ruled the market.
- The FTX Collapse (November 2022). A crash followed by a long, exhausting depression. What to check: Funding rates. A backtest will show how long the bot sat in drawdown. If it’s weeks, be assured that funding fees will destroy your profit, even if the chart shows a gain.
- The August Flash Crash (2025). A sharp 20% market dump in 24 hours with an instant buyback. What to check: Grid settings. Bots with steps that were too tight (0.2-0.5%) would have accumulated positions too early and been liquidated before the bounce even started.
Here you are verifying if your deposit has enough safety margin for “Black Swans.” If your strategy survived these dates, it has a right to exist.
Metrics: Facing the Truth
Raw profit is deceptive. You might make 100% in a month, but if you risked losing 90% in the process, such a strategy is a ticking time bomb.
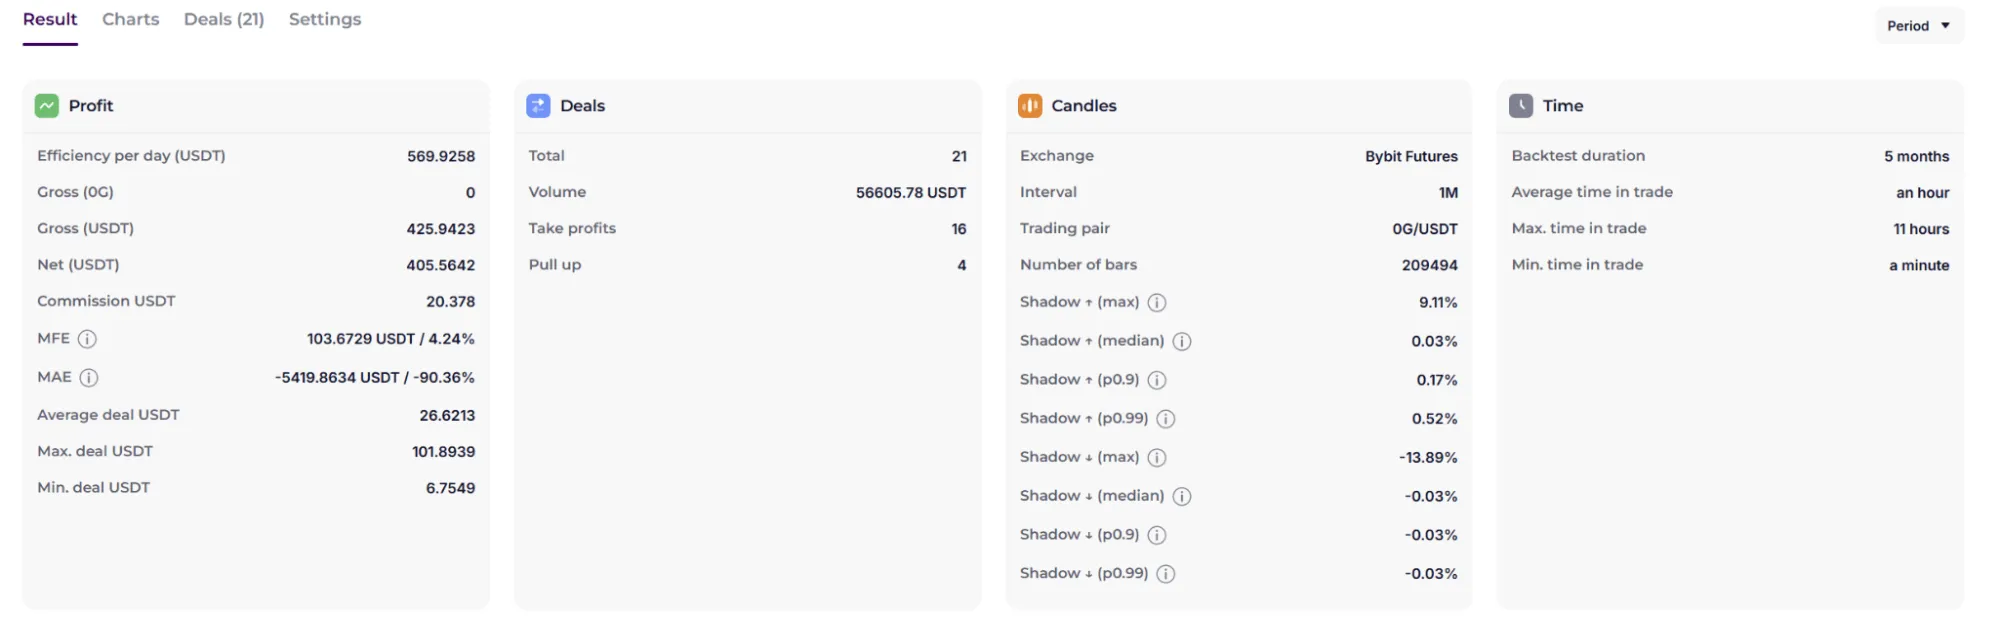
In the Veles backtest results, look at two key lines:
1. MFL (Max Floating Loss)
This is your main risk indicator (on the screenshot — bottom left of the “Profit” block). This figure shows how deep your balance went into the red at the terrifying moment of the test.
- Example: If your Net Profit is +400 USDT, but MFL shows -5400 USDT (or -90%), you cannot launch this strategy. You earn little but risk disproportionately more.
- The Norm: For conservative trading with leverage, MFL should not exceed 15-20%.
2. Net Profit
Look specifically at Net, not Gross. Net is the real money that remains after deducting all exchange commissions. Often, a strategy trades profitably but makes thousands of small trades, and commissions eat up the entire profit.
3. Risk/Reward Ratio
Divide your Net Profit by the absolute value of the MFL (in dollars).
- If you earned $100 but risked a drawdown of $500 (a ratio of 0.2), this is a bad result.
- A good strategy is when the potential profit is at least comparable to the historical drawdown.
Summary
Even an ideal backtest does not guarantee profit. In reality, market physics intervenes:
- Slippage. We model price degradation, but reality can be harsher. In moments of panic, liquidity in the order book can vanish completely, and your position might be closed with a huge loss that is impossible to predict historically.
- Psychology. A test is cold mathematics. In real life, seeing a 30% drawdown, you might want to intervene manually, stop the bot, and lock in a loss at the very bottom.
Use Veles to find the truth, not for self-reassurance. Turn on “Pessimistic Mode,” account for commissions, and test strategies on crisis dates.
Good luck with your tests and may your PnL be green!