



Veles backtests just got closer to live trading
Backtests can now be run on tick data.
Until now we ran calculations on one-minute candles. It’s a perfectly workable model, but it has a precision ceiling. That ceiling is what this article is about. Anything that happens inside a minute, a candle doesn’t capture. Tick data removes that limit.
Let’s look at where it shows up and what tick data changes for a strategy.
Candle vs. tick: what’s different
A candle is like a snapshot of the market. It shows the open, high, low, and close for a period. What it doesn’t show is how price actually moved inside that period.
A simple example. A real BTC/USDT one-minute candle on Bybit Futures, 10 August 2026, 15:13 UTC:
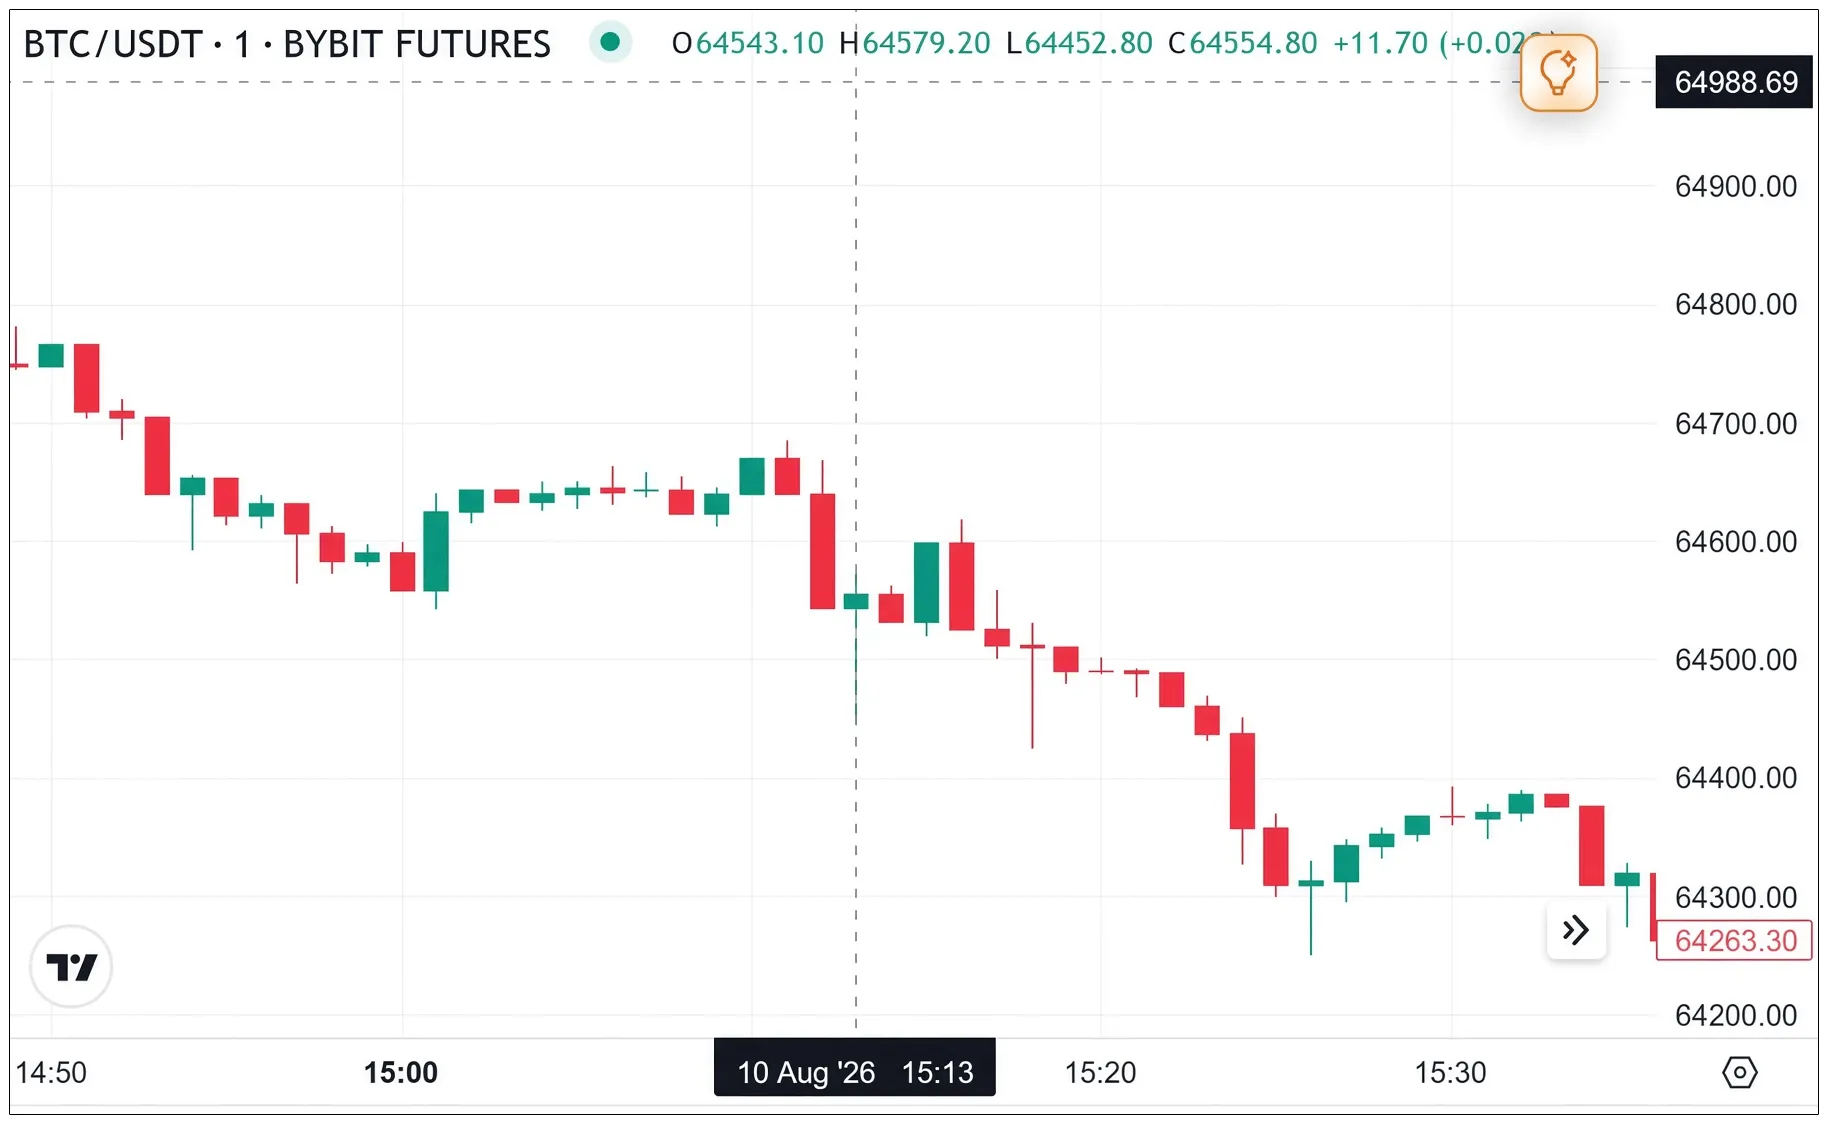
| Field | Value |
|---|---|
| Open | 64,543.1 |
| High | 64,579.2 |
| Low | 64,452.8 |
| Close | 64,554.8 |
The minute closed almost where it opened — up 11.7 points. But inside that minute, price ran 36 points up and 90 points down, on a volume of 579 BTC. Which happened first — the move up or the move down — the candle doesn’t say. If there were orders sitting at those levels, the answer decides the outcome of the trade.
A tick is like a video recording. It shows every trade on the exchange in the exact order it happened: price, volume, timestamp. The engine replays history exactly as it was, with no need to fill in the gaps with assumptions.
As long as only one event happens inside a minute, candle-based backtests are enough. The gap opens up when several events happen inside a single minute.
When the order of events changes the trade outcome
1. Take-profit and stop-loss inside the same minute
The simplest case: within a minute, price touched both the take-profit and the stop-loss.
Let’s use the same candle. A bot holds a Long on BTC/USDT:
- average position price — 64,500
- take-profit +0.1% — 64,564.5
- stop-loss — 64,455
The minute’s high of 64,579.2 hits the take. The low of 64,452.8 hits the stop. The result of the trade — plus 0.1% or minus 0.07% — depends on which happened first.
How this was calculated on one-minute data:
- The “Account for candle wicks (pessimistic)” option enabled — if the take and stop were both crossed within one bar, the stop won. A conservative assumption: the test didn’t flatter the result, but it didn’t reproduce it either.
- The option disabled — wicks were ignored entirely, and neither touch counted: the test kept the trade running even though in live trading it would already have been closed.
A separate case is a percentage stop-loss combined with an indicator-signal stop-loss. They work independently, and whichever triggers first wins. Inside a single minute, “first” can’t be determined on candle data.
On ticks, there’s no scenario to choose: the order of touches is read directly.
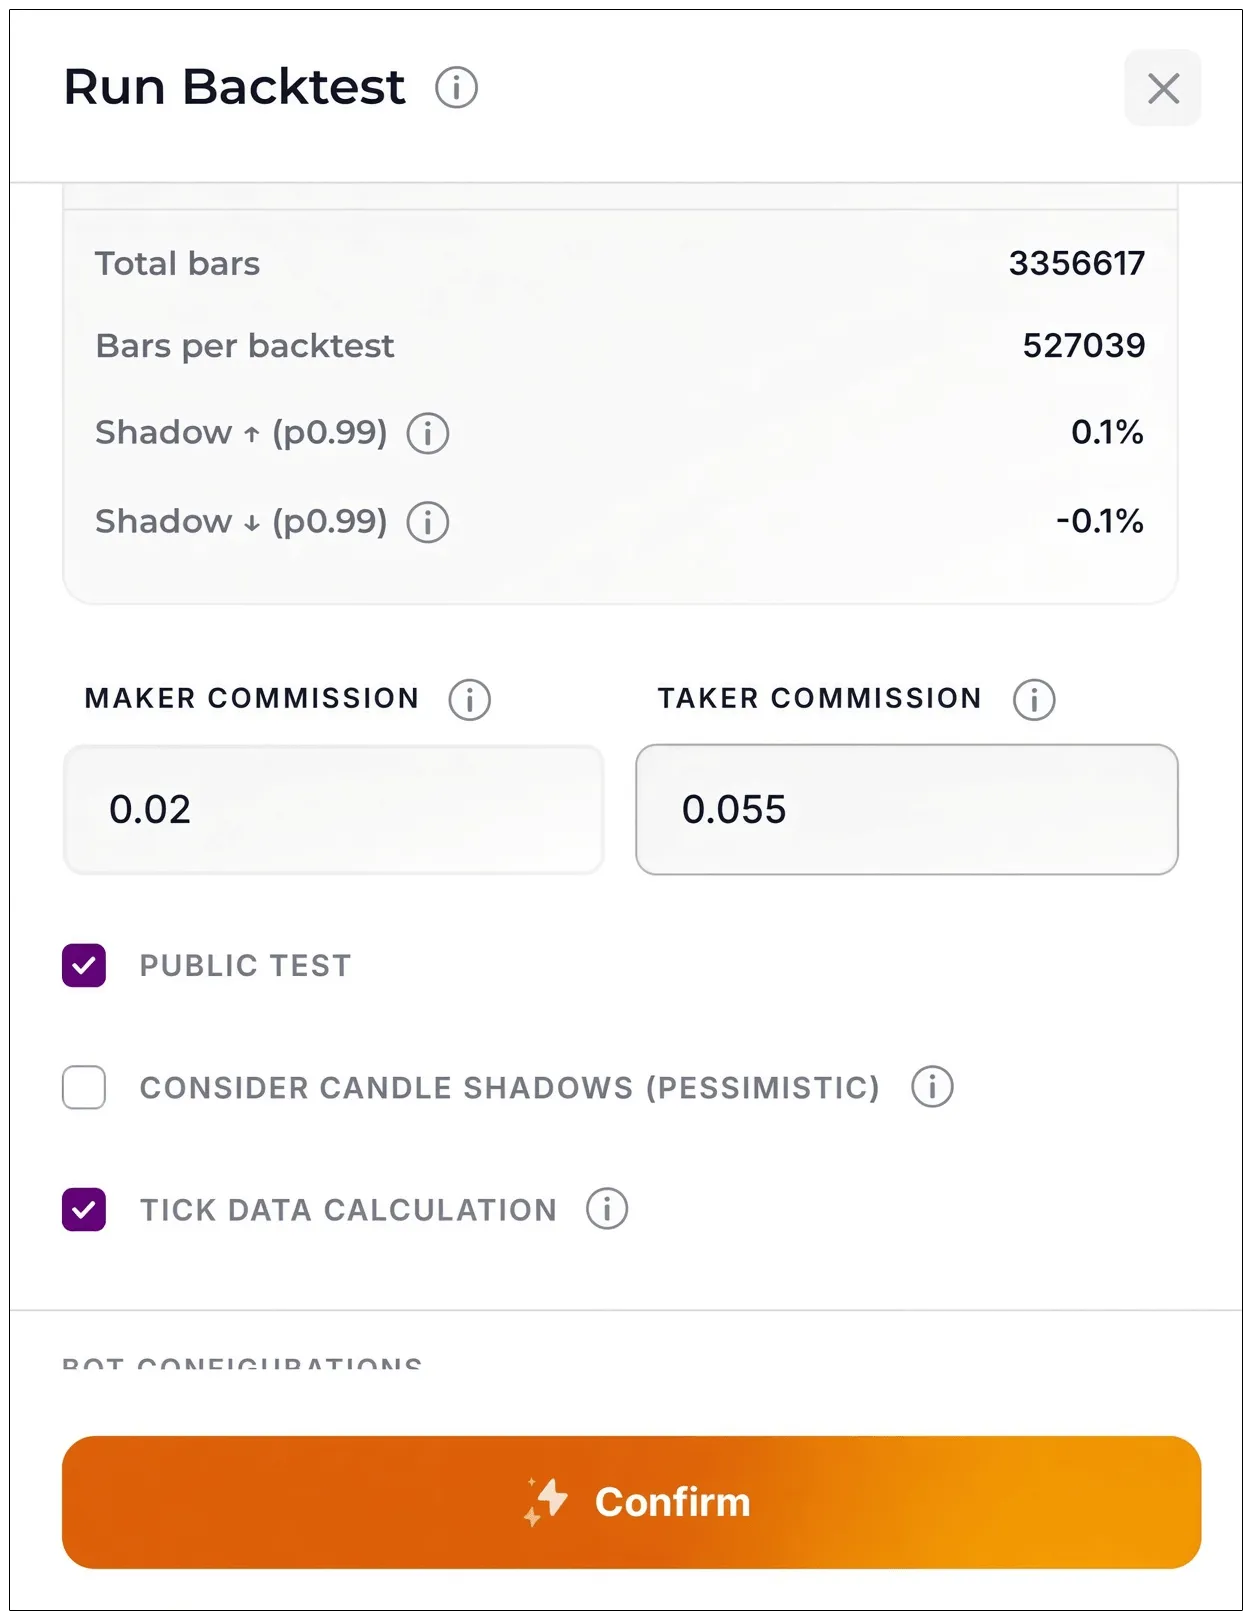
Who this affects: anyone running a take and a stop together, especially with a tight take — the two levels sit close and end up in the same bar more often.
2. Multi-takes and break-even stop
In the previous case, both levels existed from the start, and the only question was the order. This one is trickier: the second level appears as a result of the first event.
In “Own” mode, the take-profit can be split into several levels — the position is closed in parts as profit grows. After the first take fills, the bot cancels the averaging grid and sets a break-even stop-loss: at the average position price or at the previous take, depending on the setting.
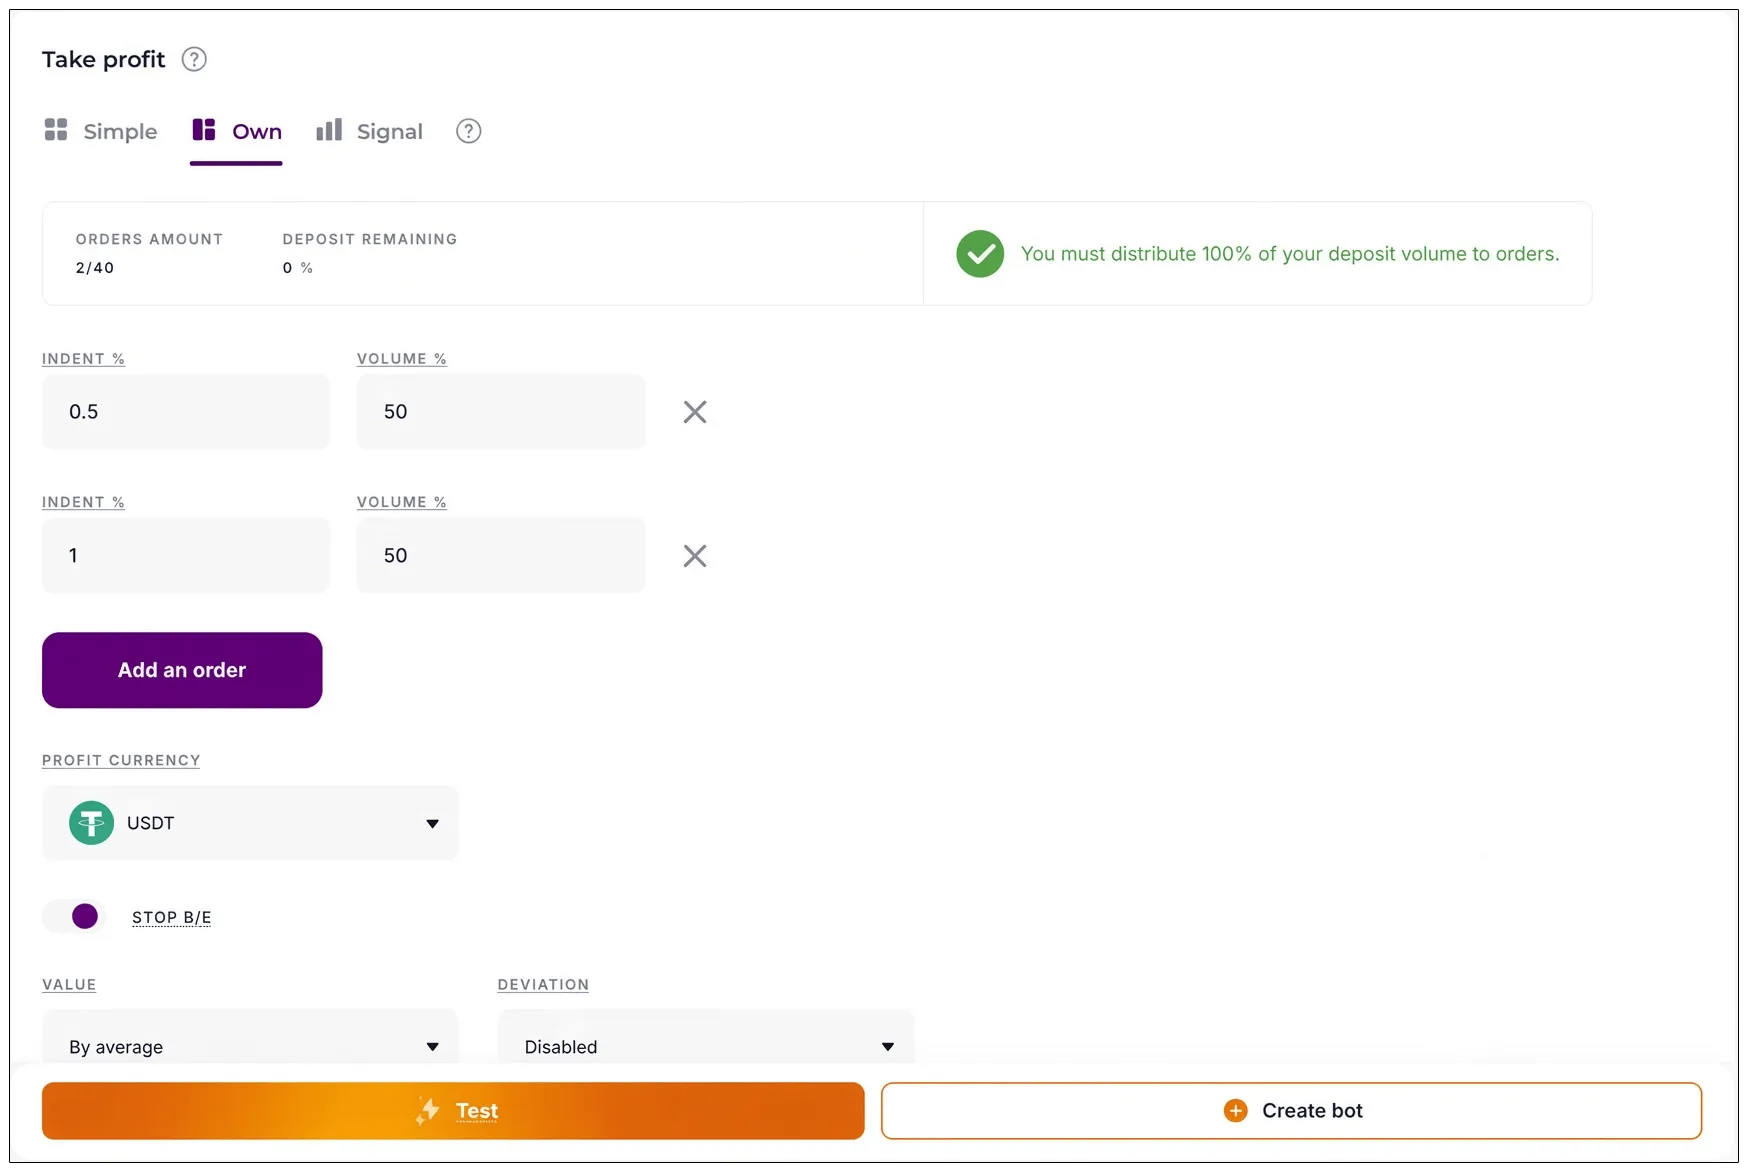
Let’s use the same 15:13 UTC candle. Suppose the bot opened a Long on BTC/USDT:
- average position price — 64,500
- first take — +0.1%, i.e. 64,564.5, closes half the position
- break-even stop — from the average price, no offset: 64,500
What lands inside this minute:
- high 64,579.2 — above the first take, so the take is touched
- low 64,452.8 — below the break-even level, so it’s touched too
One candle produces two different outcomes.
Scenario A — high first. The first take fires, half the position closes in profit, the averaging grid is cancelled, a break-even stop is placed at 64,500. Price then drops to 64,452.8 and takes out the rest of the position at break-even. Trade fully closed, result — profit on the first take.
Scenario B — low first. The break-even stop doesn’t exist yet at that moment: it only appears after the first take. Price passes through 64,452.8 with no consequences, then climbs to 64,579.2 and fills the first take. The trade continues with half the position and the stop in place.
One minute, the same four numbers — two different positions at the end. In the first scenario, the bot is flat; in the second, it holds half a position with an open stop. On a one-minute candle, the engine picks the scenario based on a built-in assumption. On ticks, the order is known and no choice is needed.
Who this affects: anyone using “Own” mode with two or more takes. The closer the takes are to each other, the higher the chance they collapse into a single minute.
3. Wicks and stop-losses
A wick (shadow) is an extreme inside a candle. By default, minute-candle wicks weren’t used in calculations, and long shadows didn’t “catch” orders.
What followed from that:
- Fewer stop-losses in the test than in live trading. In reality, wicks trigger averaging orders, SL and TP fills, and in some cases liquidations. In the test, some of these events weren’t captured.
- MAE (Maximum Adverse Excursion) came out more conservative than reality. Drawdown on a wick in a live market can be deeper than what the test showed.
That’s the reason for our recommendation to set the stop-loss roughly twice as far as the corresponding wick (p0.99) and to size margin with a buffer: %MAE + % of the maximum wick. It was a correction for the model’s precision ceiling.
On ticks, every level touch is visible as it is — together with the moment it happened.
Who this affects: anyone trading with a fixed stop-loss, and especially anyone estimating liquidation risk from MAE.
4. Grid pull-up
Pull-up cancels a trade if the bot placed limit orders and price moved the other way, so the first order never filled.
In live trading, the bot tracks the pull-up level on ticks. In the backtest, it was calculated on the close of a one-minute candle. Different methods — different results: price could reach the pull-up level inside the minute and come back, and the candle wouldn’t show that move.
Practical takeaway: we recommend checking in the backtest how many trades are cancelled by pull-up — it’s one of the main knobs for tuning the grid. Now that check runs by the same method as in live trading.
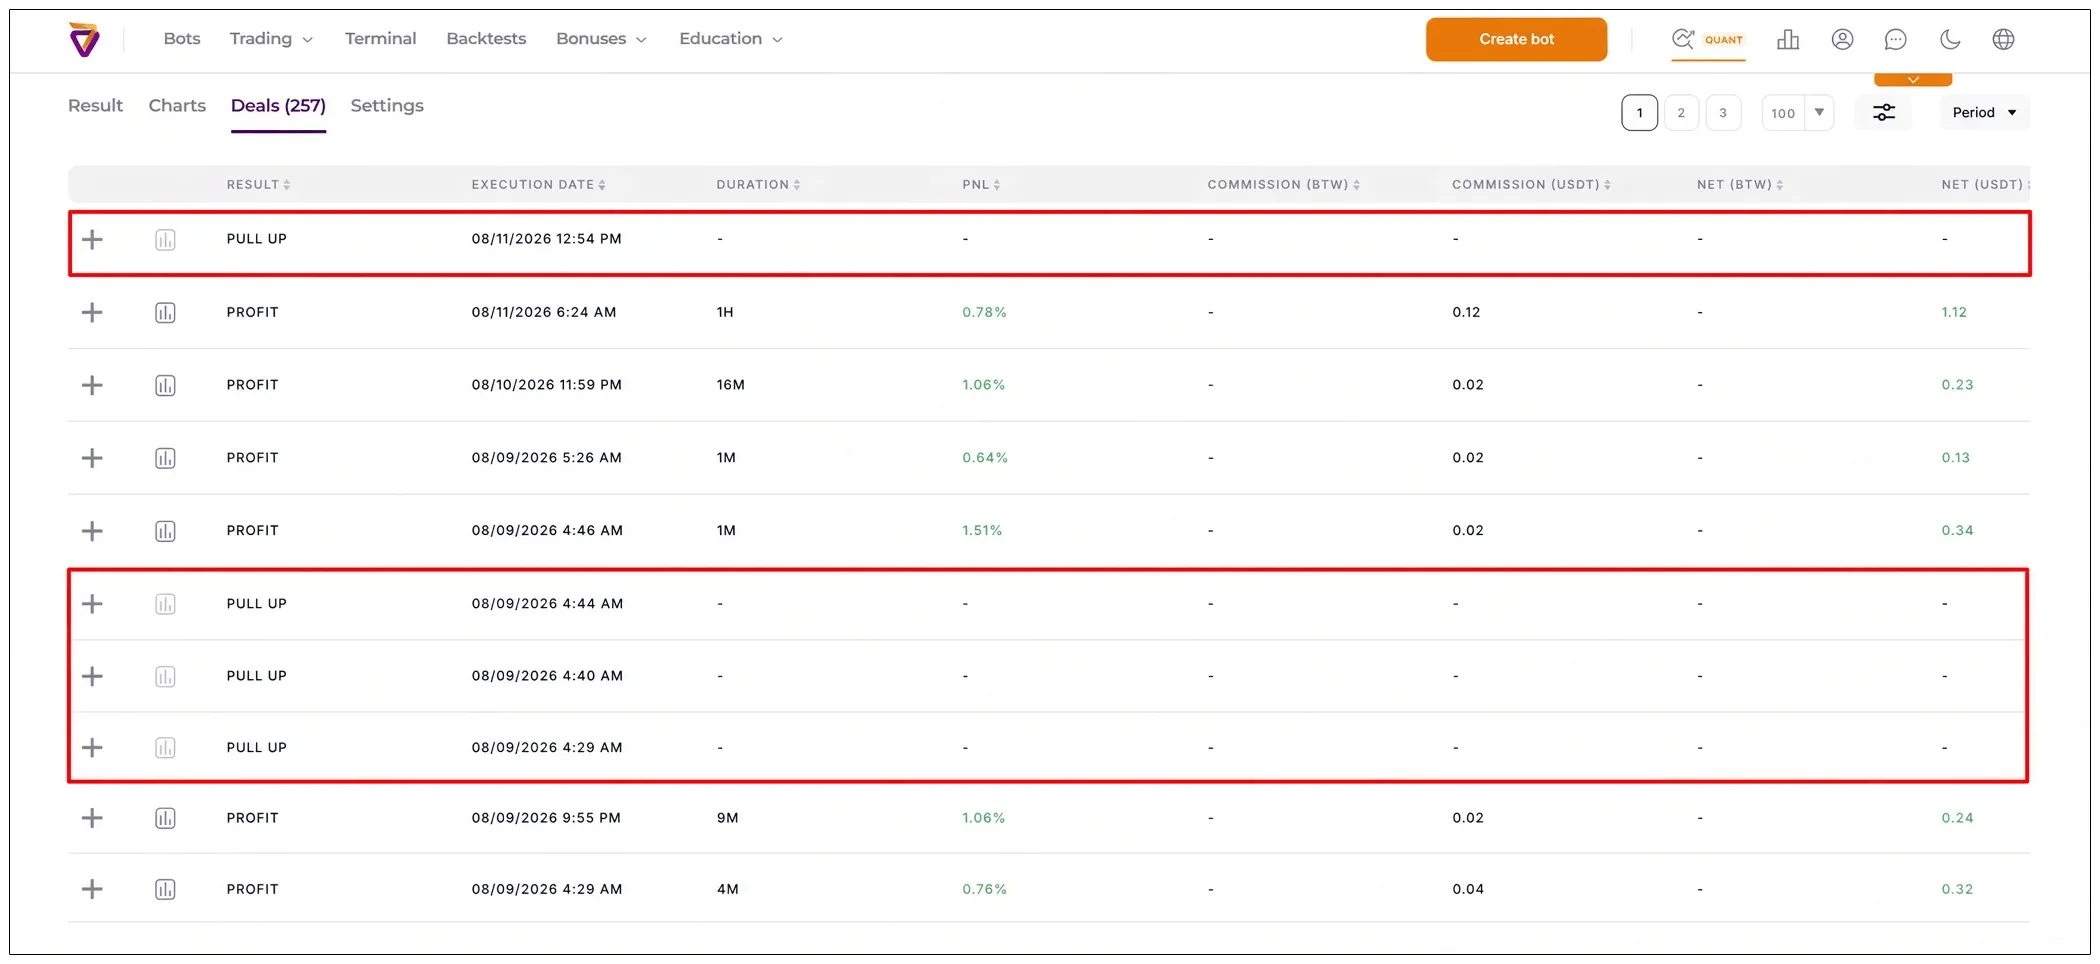
Who this affects: those whose first-order offset is greater than zero. At offset 0 (“Market”), pull-up doesn’t apply.
5. Order cancellation before the first fill
One more modelling quirk: if the take-profit conditions were met in the backtest before the first order filled, the orders were cancelled. In live trading, the bot waits for the fill in this situation. The discrepancy appeared in exactly the same place — inside a minute where both points fell into the same bar.
Who this affects: configurations with a limit entry. As a workaround, we recommended entering at “Market” with a zero offset.
What this means in practice
- A more accurate strategy evaluation. The backtest result is closer to what the bot will produce in live trading: orders fire where they’d actually fire, and the order of execution inside a minute is correct.
- A more accurate risk evaluation. MAE and stop-loss statistics account for real level touches instead of four points on a candle.
- The same calculation method in the test and in trading. Pull-up, stops, and multi-takes are modelled the same way a live bot works.
The gap between candle-based and tick-based backtests shows up most on strategies with a dense order grid, tight takes, and short timeframes — where multiple events happen inside one minute. On strategies with rare entries and wide levels, the difference will be minimal.
Who has access to tick data
Tick backtests are available on the Pro ($29/mo) and Quant ($69/mo) plans. Data — from Bybit Futures.
Market Scan and automatic indicator selection also run on these plans.
Where to start?
Take a strategy you’ve already run on candles, and run it on ticks with the same settings on the same period. Compare the number of trades, the TP/SL distribution, and MAE.
Look for the biggest gap where the take and stop sit close together and the grid is dense — that’s the zone where the candle model was working at the edge of its precision.
You can run your first tick backtest right now — in the Backtests section of your Veles Finance account. Don’t have an account yet? Sign up and get access to backtests, bots, and the strategy marketplace.