



We Calculated When the Bitcoin Bear Market Will End — and When to Buy Again
Every time the market drops, the same questions flood the chats: when is the bottom? when do we buy? The answers are usually based on gut feelings. We decided to answer with data. We pulled the entire history of BTC/USDT on Binance — price and volume from 2017 onward — and looked at how predictably the halving cycle repeats.
Turns out — almost like clockwork. Three cycles in a row, the top, the bear market, and the reversal arrive at the same intervals. Below is that “schedule,” specific dates for the current cycle, and why we trust it based not only on price but also on trading volume.
The halving cycle repeats with an accuracy of a couple of months
We compared three past cycles using monthly data. The intervals hold remarkably steady.
| Phase | Pattern | 2016 Cycle | 2020 Cycle | 2024 Cycle |
|---|---|---|---|---|
| Top | ~18 months after halving | July 2016 → December 2017 (17 months) | May 2020 → November 2021 (18 months) | April 2024 → October 2025 (18 months) |
| Bear market | ~12 months after top | December 2017 → December 2018 (12 months) | November 2021 → November 2022 (12 months) | in progress |
| Bottom | ~17 months before halving | January 2015 (−17 months) | December 2018 (−17 months) | November 2022 (−17 months) |
Three simple rules, three repetitions. Every time:
- the top comes roughly 18 months after the halving;
- the decline from top to bottom lasts roughly 12 months;
- the bottom lands roughly 17 months before the next halving.
Current cycle calendar: when is the bottom and when to buy
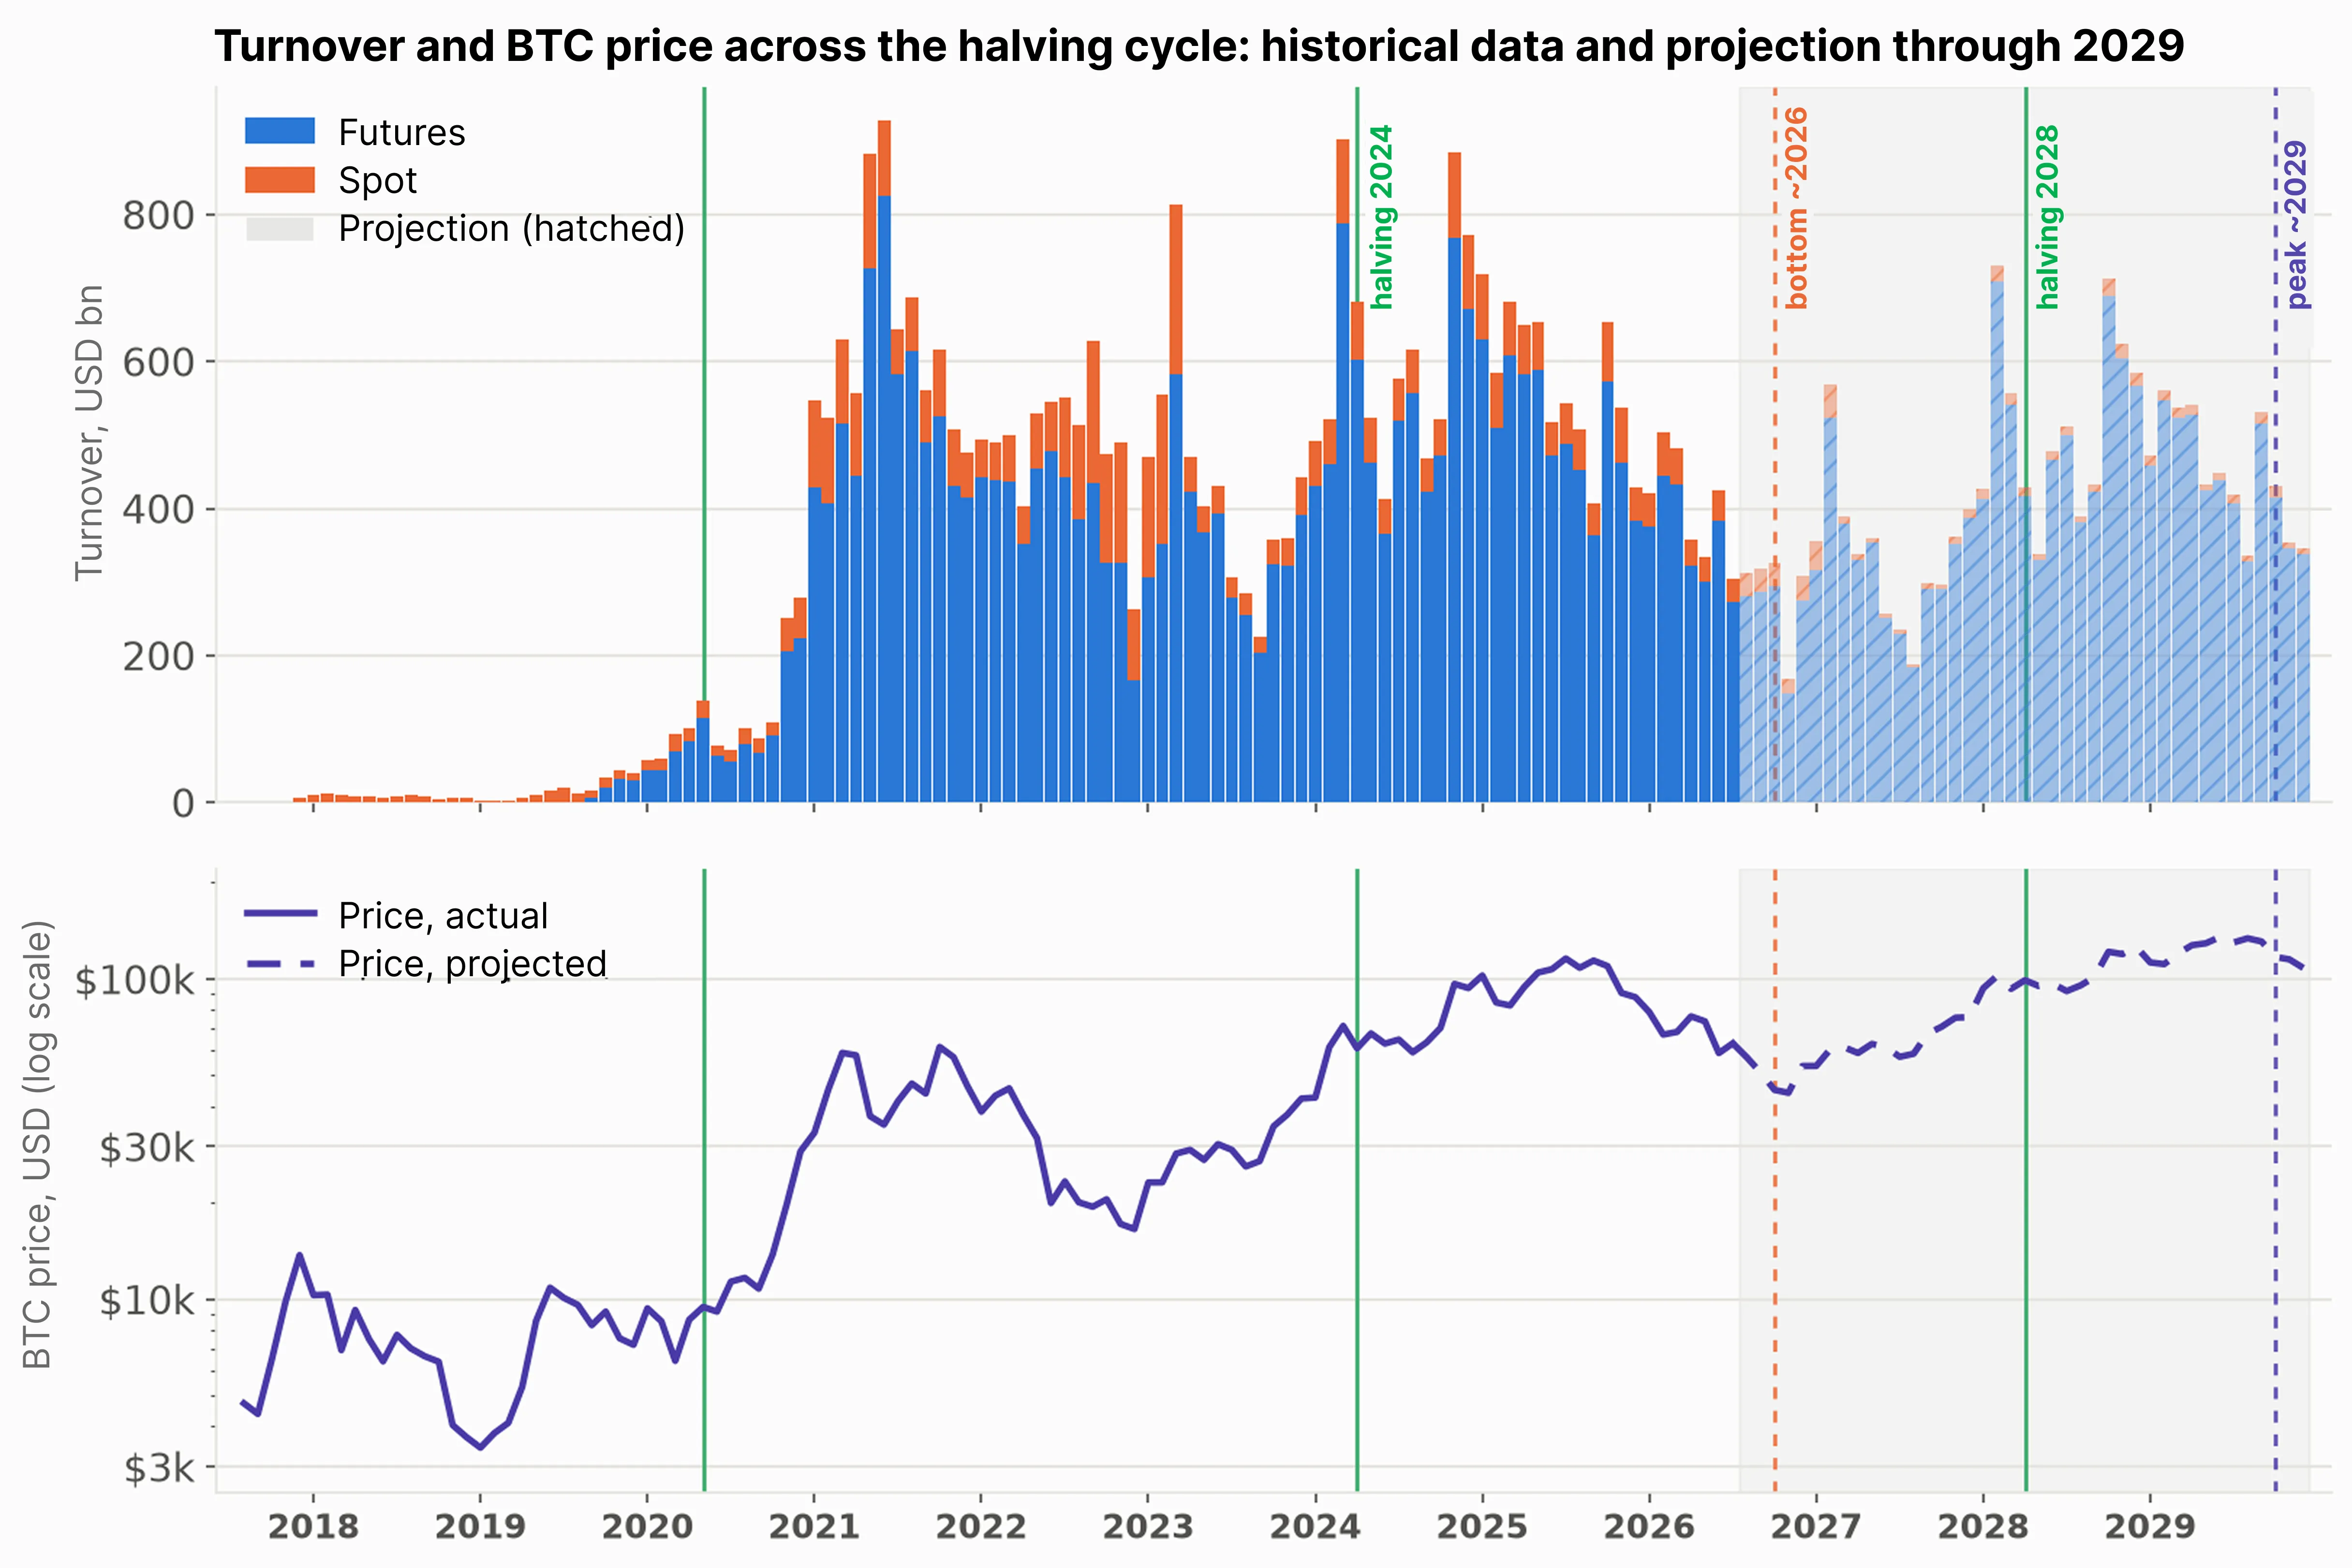
Let’s apply these rules to the current cycle. The halving was in April 2024, the cycle top was October 2025 (Bitcoin reached $126k at its peak), exactly +18 months. The rest follows in the table.
| Phase | Date (by cycle) | What it means for a buyer |
|---|---|---|
| Cycle top | October 2025 (✓ already passed) | profit-taking zone |
| Bottom / reversal | ~October 2026 | accumulation and buying zone |
| Halving | April 2028 | middle of the bull phase |
| Next top | ~October 2029 | next profit-taking zone |
Two independent calculations converge on the same point: the bottom is around October 2026. The first — “top plus 12 months of bear market.” The second — “17 months before the April 2028 halving.” Both lines point to the fall of 2026. This means that, by cycle mechanics, we are currently in the tail end of the bear market, not at its beginning.
You can wait for the bottom for a long time. Or you can launch a bot on BTC right now — it will profit both in the decline and on the reversal. Launch the best BTC bot configurations from our community and start earning with us.
Why we trust this beyond just price
Price is a single line, and you can draw anything from a single line. That’s why we verified the cycle with an independent metric — trading volume. If the cycle is real, volume should follow the cycle’s phases, not random volatility. And that’s exactly what we found.
Volume follows the cycle, not volatility. Across the entire history, the correlation between volume and monthly volatility is near zero (−0.07). But volume inertia is massive: last month’s value predicts the current one with a coefficient of 0.83. Volume moves in large waves aligned with cycle phases, not in jerks from every candle.
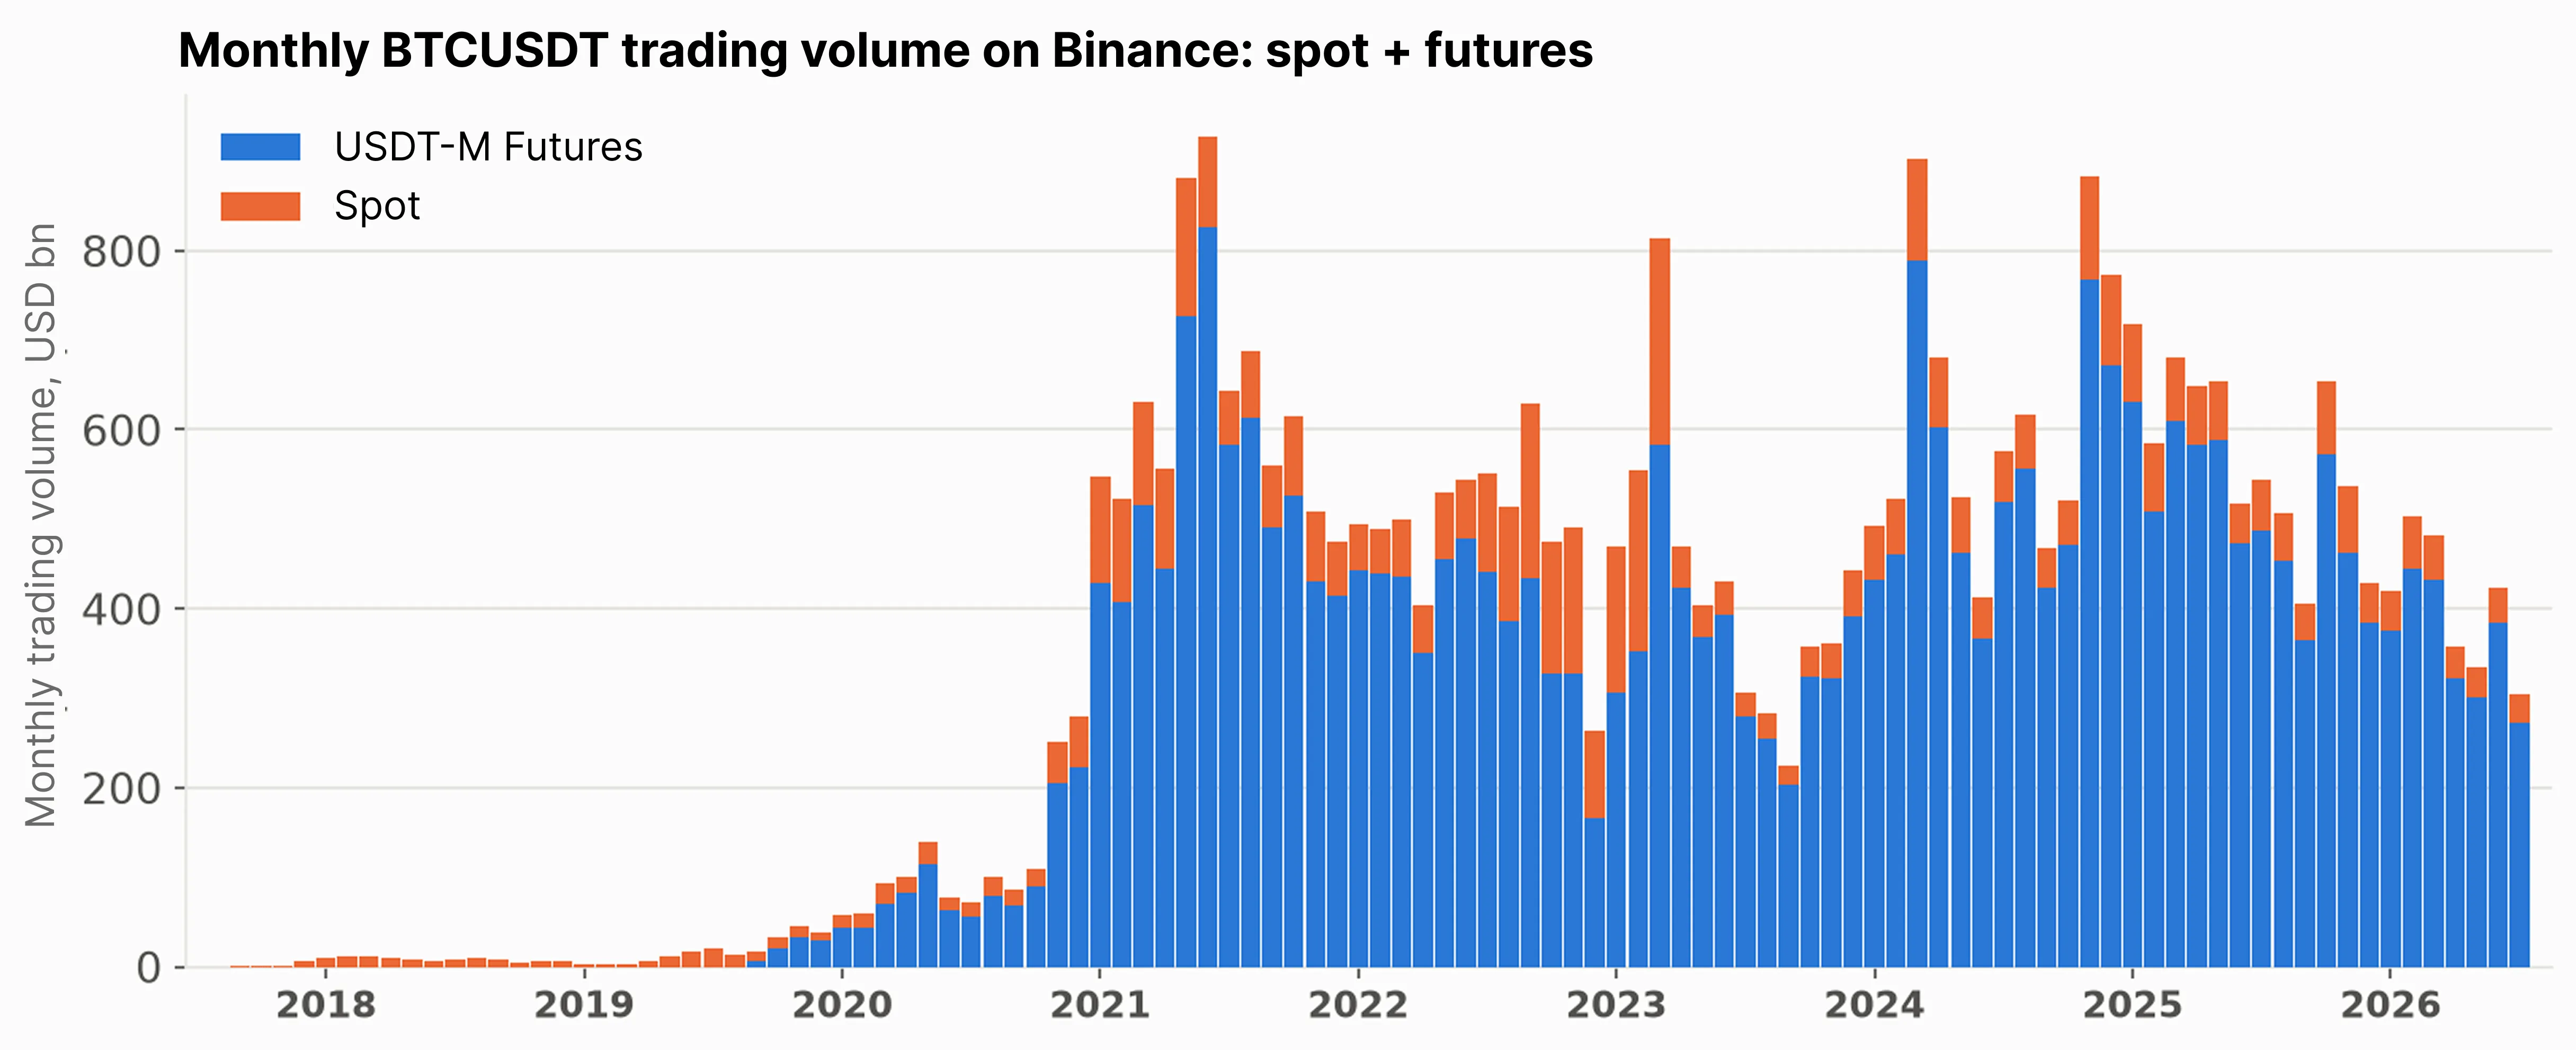
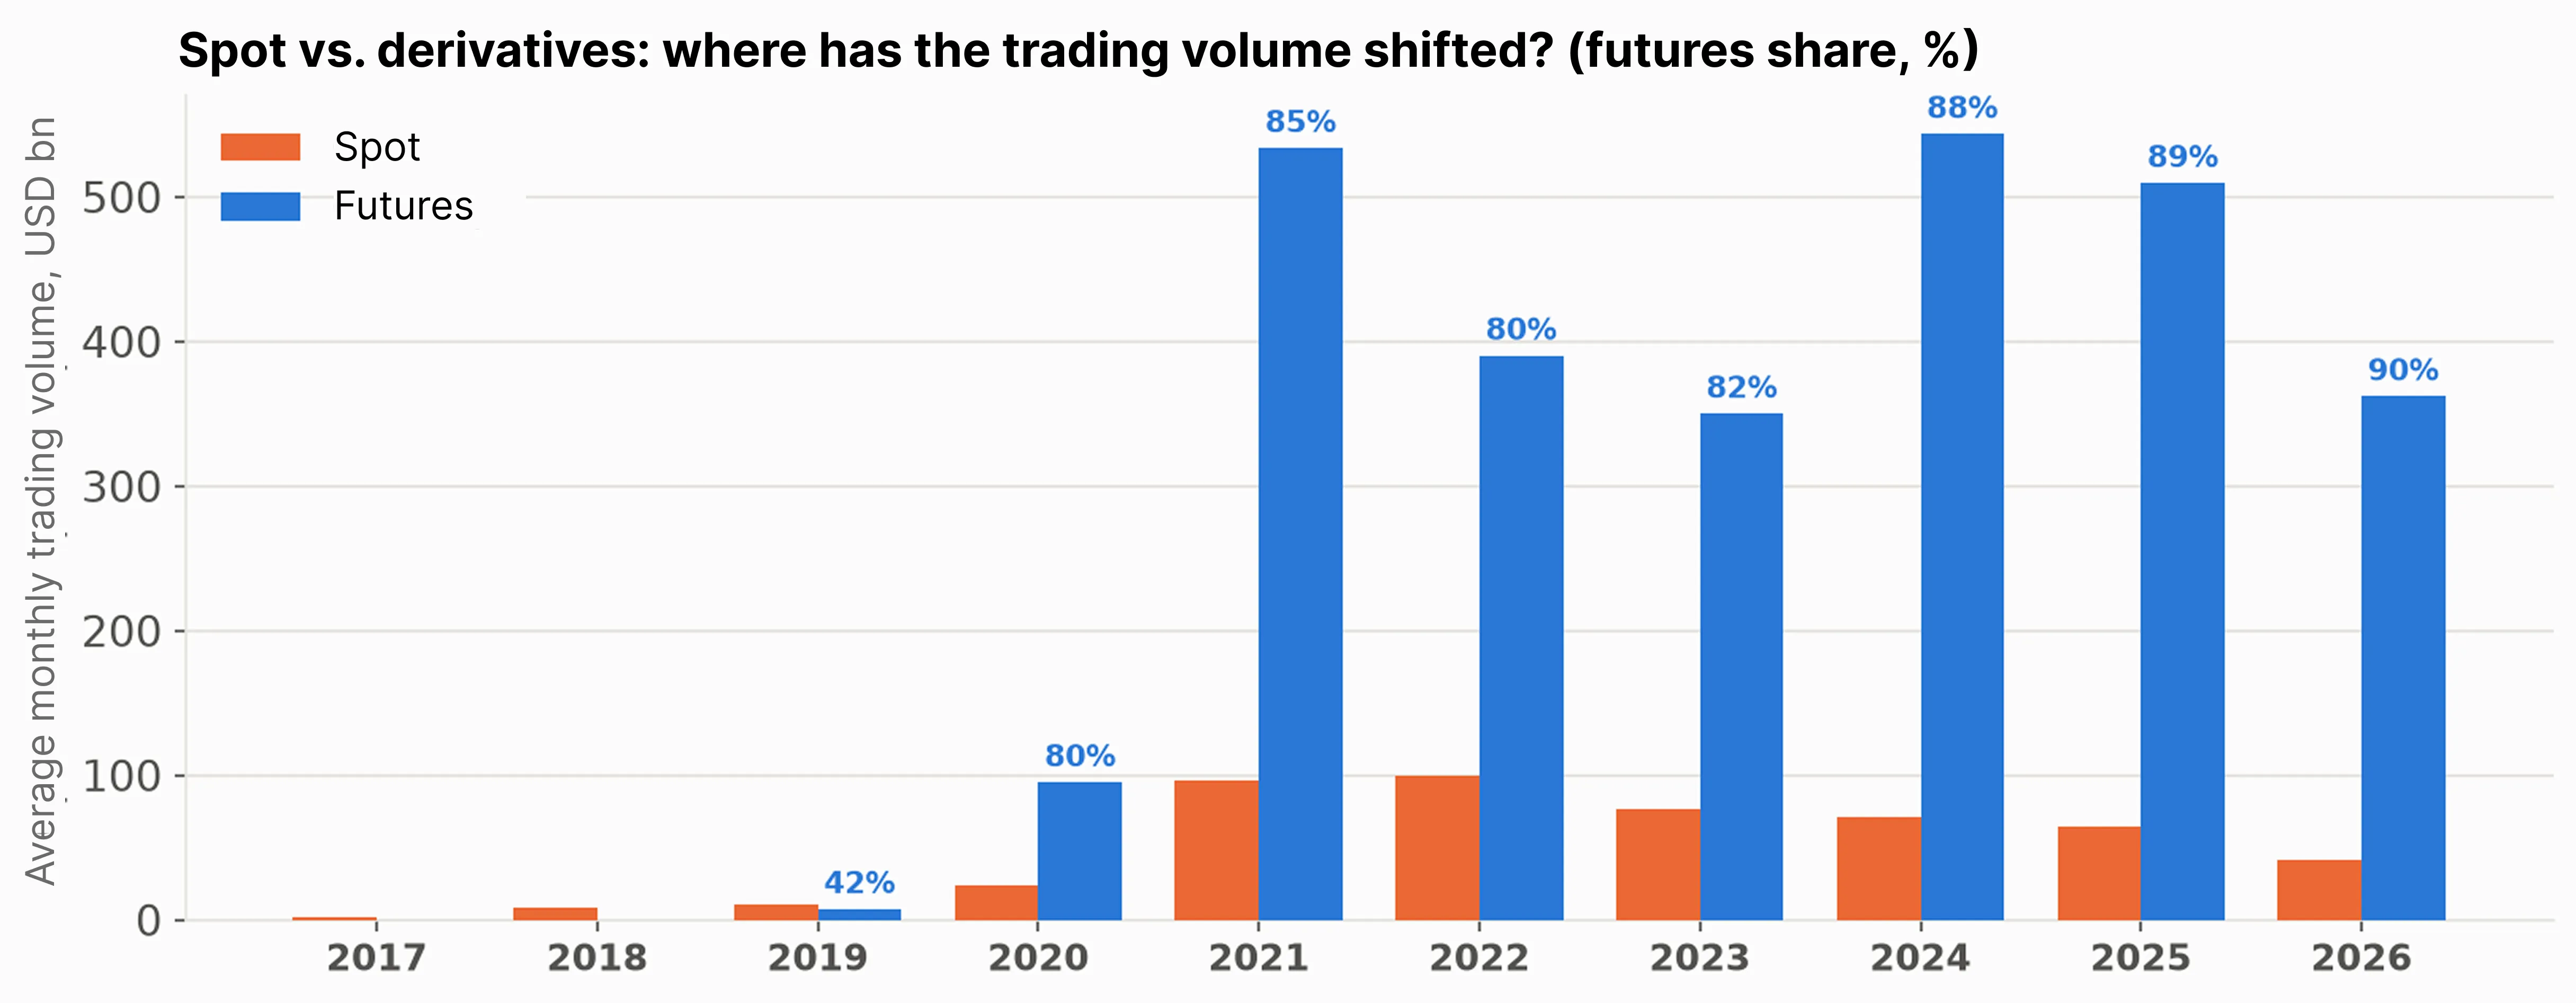
“Declining volumes” is a myth if you only look at spot. Volume simply migrated to derivatives: in recent years, futures accounted for 85% of total volume — 5.75 times more than spot. Spot volume has been fading since 2021, but futures volume in 2024 actually exceeded the 2021 peak. The market didn’t deflate — liquidity moved to where there’s leverage.
This matters: interest in BTC is alive, and it confirms that the cycle continues.
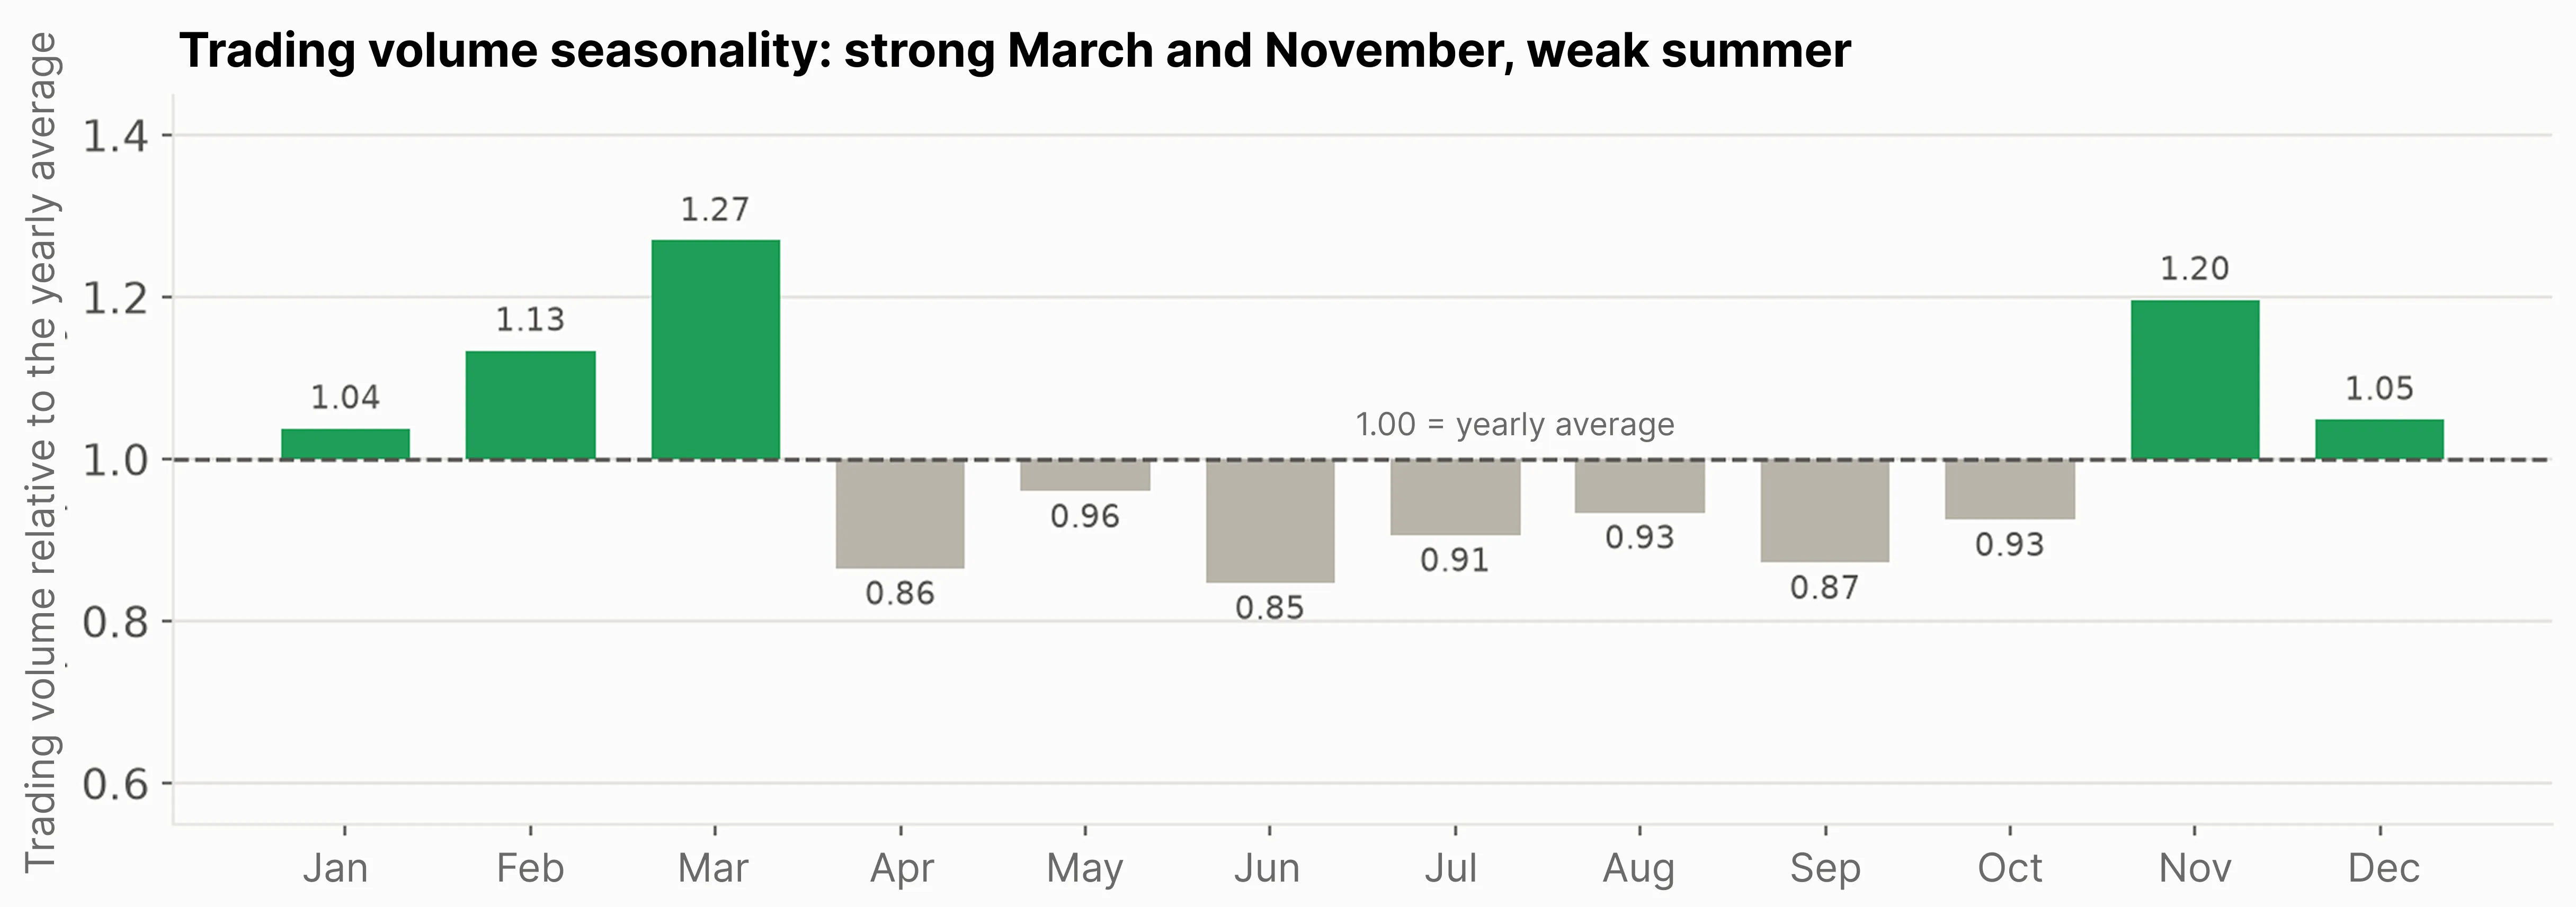
Even seasonality is consistent. After removing the cycle trend, we see a stable profile: strong March and November, weak summer. This doesn’t override the cycle phase, but it hints at which months historically see higher activity.
Three independent observations — volume inertia, derivatives dominance, and seasonality — all point to the same conclusion: the market moves in structural phases, and these phases align with the halving cycle. This means the calendar above can be trusted not as fortune-telling, but as statistics.
What this means in practice
Putting it all together, the cycle-based strategy looks like this:
- Accumulation zone — around the bottom, fall 2026. The bear market lasts ~12 months from the October 2025 top, meaning we are already close to the reversal, not at the beginning of the decline.
- Main growth phase — 2027–2028, leading up to the halving and beyond. Peak volume, by projection, arrives during the acceleration (~2028), ahead of the price top — money enters the market as the trend accelerates.
- Profit-taking zone — around the next top, ~October 2029.
A separate note on price levels: the amplitude of each cycle is weakening. The “bottom → top” multiplier dropped from ×18 (2018→2021) to ×6.7 (2022→2025). If the trend continues, the next peak will be only modestly higher than the previous one — in a conservative projection, that’s a bottom around ~$45k and a top near $135k. This is an assumption, not a promise.
This is a statistical analysis of historical data, not investment advice or a guarantee of specific dates or prices. The cycle benchmarks are based on just three repetitions; the amplitude of movements is weakening, and market maturity (ETFs, institutional players, macroeconomics) may break past patterns.
“Bottom in October 2026” is a working hypothesis with a margin of a couple of months, not a fixed date on the calendar. Cryptocurrency trading involves the risk of capital loss — make your decisions independently.
Data: Binance public API, monthly candles (api/v3/klines and fapi/v1/klines, interval 1M), quoteVolume metric per month in UTC, calculations based on completed months (August 2017 — July 2026). We will revisit this analysis at the end of 2026 and compare the bottom hypothesis against what actually happened.